6045 Kenwood Building
🚨

Chicago Building ID: 172151
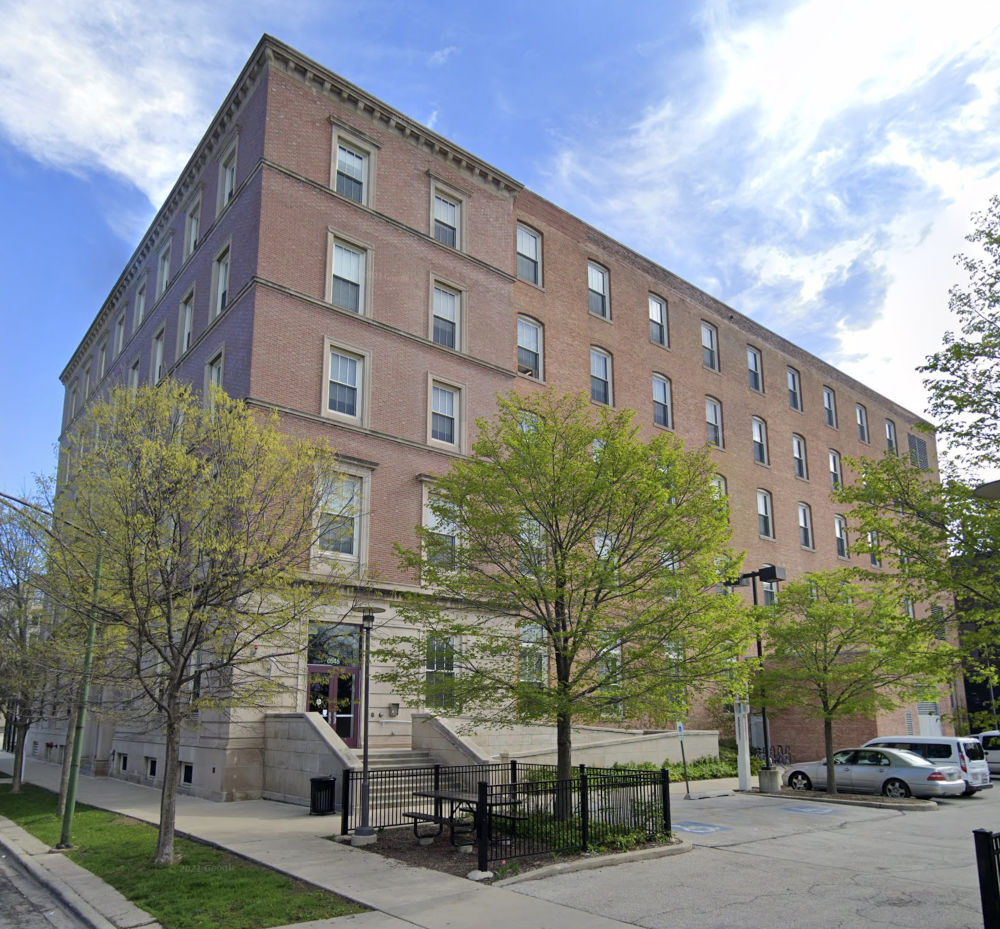
Attribution:
© Google 2023
Image Source
. Cropped from original.
Building Info
- Square Footage
- 99,163 sqft
 Lower than 93% of others1/3 the median, 1/5 the median OfficeMedian benchmarked building*:296,415 sqftMedian benchmarked Office*:496,678 sqft
 - Built
- 2009
- Primary Property Type
- Office
- Community Area
- Woodlawn
-
Chicago Energy Rating
- 1.0 / 4
- Owner
 View All Tagged UChicago Buildings
Note: Owner manually tagged. Logo used under fair use.
Emissions & Energy Information
- Greenhouse Gas Intensity
- 51.1 kg CO2e / sqft
 #9 Highest in Chicago* 🚨#1 Highest of Offices 🚨7x the median, 7x the median OfficeMedian benchmarked building*:7.7 kg CO2e / sqftMedian benchmarked Office*:7.8 kg CO2e / sqft
 - Total Greenhouse Gas Emissions
- 5,069 metric tons CO2 eq.Higher than 85% of others2.5x the median, 1.4x the median OfficeMedian benchmarked building*:2,063.4 metric tons CO2 eq.Median benchmarked Office*:3,550.2 metric tons CO2 eq.
- Source Energy Usage Intensity
- 907.7 kBtu / sqft#10 Highest in Chicago* 🚨#1 Highest of Offices 🚨6x the median, 6x the median OfficeMedian benchmarked building*:143.1 kBtu / sqftMedian benchmarked Office*:140.8 kBtu / sqft
- Site Energy Usage Intensity
- 546.2 kBtu / sqft#11 Highest in Chicago* 🚩#1 Highest of Offices 🚨7x the median, 8x the median OfficeMedian benchmarked building*:81.9 kBtu / sqftMedian benchmarked Office*:65.2 kBtu / sqft
- Natural Gas Use
- 103,570 kBtu
 #22 Lowest in Chicago* 🏆#10 Lowest of Offices 🏆1/119 the median, 1/90 the median OfficeMedian benchmarked building*:12,367,856.3 kBtuMedian benchmarked Office*:9,318,813.4 kBtu
 - Electricity Use
- 20,757,693.8 kBtuHigher than 83% of others2.4x the median, 1.1x the median OfficeMedian benchmarked building*:8,755,592 kBtuMedian benchmarked Office*:18,103,403.8 kBtu
- District Steam Use
- 5,022,596.9 kBtu1/3 the median, the median OfficeMedian benchmarked building*:12,791,107.2 kBtu
- District Chilled Water Use
- 28,280,039.8 kBtu2.9x the median, the median OfficeMedian benchmarked building*:9,674,280.5 kBtu
* Important Note: Rankings and medians are among included buildings, which are those who reported under the Chicago Energy Benchmarking Ordinance for the year 2020 with emissions greater than 1,000 metric tons.
Data Source:
Chicago Energy Benchmarking Data Covered Buildings
What Should We Do About This?
Practically every building has room to improve with energy efficiency upgrades like insulation, switching to ENERGY STAR rated appliances, and more, but for any buildings with large natural gas use, we recommend one thing: electrify!
In other words,
buildings should look to move all on-site uses of fossil fuels (including
space heating, water heating, and cooking) to electrically powered systems like
industrial grade heat pumps, heat pump water heaters, and induction stoves. With Illinois'
current electric supply, just using the same amount of energy from electricity, rather
than natural gas (aka methane) will dramatically reduce greenhouse gas emissions.
This is because Illinois' grid in 2020 was already 67% carbon-free
(see Illinois - Power | DecarbMyState ).
This has already been done across the country with a variety of buildings, large and
small, like the
Hotel Marcel
.
You can help make this a reality by talking to building owners and letting them know that a building's emissions are important to you, and that you want to see their building become fully electric and stop emitting greenhouse gases. Particularly for buildings you have a financial stake in (like your university, work, condo building, or apartment building) your voice in concert with your fellow building users can have a huge impact.
Additional Resources
See some additional resources on improving energy efficiency and understanding this data: